The Data Your Data Could Smell Like

Note: This document is originally from work conducted with Ian Pearce and has been transcribed here for posterity. Read on for the original work conducted by us and largely aggregated via our old platform, 140kit.
The Man Your Man Could Smell Like:
Twitter Analytics Report
a publication of the Web Ecology Project
(1 August 2010)
Authors
Devin Gaffney & Ian Pearce
with Alex Leavitt and Matt Morain
About The Web Ecology Project
The Web Ecology Project is an interdisciplinary research group with presences in Boston, MA, New York City, NY, and San Francisco, CA that analyzes the system-wide flows of culture and community online.
Please visit our website (http://webecologyproject.org) or contact us via email at contact@webecologyproject.org.
The Web Ecology Project releases this paper under a Creative Commons Attribution Share-Alike 3.0
license (http://creativecommons.org/licenses/by-sa/3.0/).
Determining Twitter Value
Understanding the impact of social media in any event is of paramount value in today’s market - in the case of an advertisement campaign such as this one, it is absolutely necessary in order to evaluate the work done. At the same time, this platform is unlike previous mediums measuring the impact of something such as television, radio, or print can be done in a centralized manner an absolute volume of the campaign assets are produced and distributed for digestion. With an absolute volume, it is relatively straightforward to translate the resulting impact by comparing previous and current sales, perceptions, and other metrics surrounding the brand in question.
With online content, although the volume of campaign assets created is set, its distribution is not. For this reason, it is necessary to sample the medium for responses to the campaign to begin to understand how users reacted to the campaign.
By pulling a large sample of Twitter data, we can measure the actual distribution, or more accurately, diffusion, of the campaign through the network. Although it is technically impossible to capture 100% of the data given limited access issues, a large enough sample suffices for reasonable conjectures and clear senses. It is similarly impossible to say with complete certainty that online action translates to offline results, as there is simply not enough data on the subject, particularly in the case of social media. Again, however, through a careful review of the results we can determine the rough efficacy of the campaign, which, coupled with the offline results of
the campaign, may be useful for the client.
Overview
Total number of Tweets Collected: 63,382
Total number of Users Collected: 46,529
Capture Range: July 14th, 6:18:15PM EDT - July 31st, 5:30:11PM EDT
Total number of participatory Tweets: 18,423 (29.06%)1
Most Referenced User: @OldSpice (9,608 links to user in network graph)
Most Referenced URL: http://oldspicevoicemail.com/ (After all traffic to YouTube)
Most Referenced Hashtag: #oldspice (6,464 mentions)
Most Used Context-Specific Word: guy (13,170 uses)
General Analysis
The general analysis of the data comprises a few core metrics available through the Twitter API that are generally easy to interpret for a quick and general sense of the data set. These analyses are either based on the Tweets or the Users Tweet analysis tells us what was said, User analysis tells us who was saying it.
Population
The General User Population shows data consistent with being an active, high-use population.
From our database of around 25M Users, we selected 100,000 random accounts and generated the average number of statuses, friends, followers, and favourites [sic]. From this result, we found that the data from the Old Spice campaign was clearly above a standard average user’s level (in that their average status count was much higher than the average, suggesting much more active participation in the social network):
Fig 1: Average Status, Friends, Followers, and Favourites counts for Users in Old Spice data set (light blue) and random sampling of 100,000 Users.
Table 1: Summary statistics for accounts in Old Spice Data set versus random sample of users
Gender
We were also able to use the TrueKnowledge.com Database to determine rough estimates for the gender of the users transmitting messages. Of the 60,251 Users, 4,007 were randomly sampled for gender 1,399 were male, 984 female, and 1,624 could not be positively identified as either.
Although specific numbers are not immediately available, the TrueKnowledge.com Database has anecdotally exhibited an 80% accuracy with properly assigning gender to given names.
Fig 2: Randomly sampled gender of 4,007 Users in Old Spice data set, generated from True Knowledge
database.
Account Creation
For further confirmation on the theory that the User base was a longer-standing active population, we looked at the User account creation dates—the bulk of these users signed up during Early ’09, which corresponds to a major jump in account creations. There is, however, a less common account creation level prior to 2009 that, when compared to other data sets, implies that the user base is particularly old. This further suggests that this is not a general user base, but a more tech-savvy base that has been using the social
network for a fair amount of time. As comparison we looked at a “one” data set, which essentially delivers random users (as “one” is a fairly situation agnostic term on Twitter):
Fig 3: Account creation dates for “One” Data Set, 23,924 Users
Fig 4: Account creation dates for Old Spice data set.
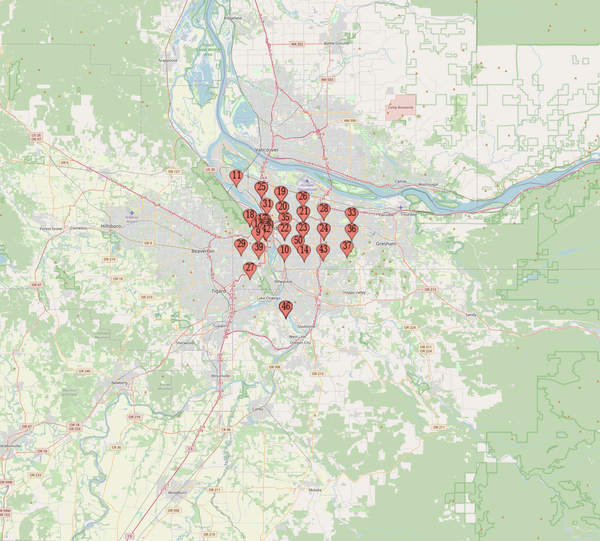
User Location
Fig 5: Time zone breakdown for Old Spice data set
The Users appeared to be primarily located in the US, with the notable exception of a few major international cities. 68.52% of the users were located in American time zones, which is generally reliable information. The general distribution of this data firmly lies with previous studies of a predominantly American base with international regions dispersed throughout. More specifically, as with most data sets, the Eastern time zone is the zone for the plurality of accounts.
Message Volume
As would be expected, the bulk of data transmitted took place directly after the new burst of ads were shot - July 15th was above and beyond the most busy day for the data set. While this is certainly significant beyond any reasonable doubt, the sampling may be in question as the data collectors were not actively seeking Old Spice content before the campaign even began. The Information captured, however, does appear to strongly suggest that the peak of activity did in fact occur at that time, and quickly tapered off from there - similar effects have been seen in previous data sets, and this is likely a normal Twitter behavior. A graphic displaying Twitter
activity during the Iran Election of 2009 shows similar behavior:
Fig 6: Tweet Publish Times, #IranElection Data Set
Fig 7: Tweet Publish Times, Old Spice Data Set. Note the similar precipitous drop following the major event
This behavior of a large spike during the days immediately following the creation of a campaign (regardless of its provenance) seems to be a recurring event, largely due to a joint action between the positive loop of immediate information (new information is more valuable as a posting commodity, and is reposted much more) and the inability for any campaign to be sustained by the mass network over time (which in and of itself is a component of the immediate value of information). Similarly, as the campaign gains popularity and its exposure time increases, it is likely to diffuse through many forms of communication as opposed to any particular platform, (eg memes spreading from 4chan to smaller forums, articles leaking through Reddit to Twitter/
Facebook, etc...).
Content Analysis
The Tweets in this data set suggest that beyond being a marketing campaign, the “Old Spice Guy” YouTube campaign has become a bona fide internet meme. With any contemporary internet meme, there is generally a significant level of evolution and re-distribution, which contextualizes the meme in new ways; by doing this enough, users are able to see many variances of the theme, and the theme itself is what becomes the memetic aspect, as it can be used and reused for different contexts as parody, evolution, or just in the original format. In this
data, evolution and re-distribution was paramount. YouTube videos and Tech articles about the commercial series predominated the URL lists hash tags such as “#spiceboy”, “#ciscospice” and “#helpmeoldspiceguyyourmyonlyhope” suggest the process of evolution is taking place anecdotally, many new response videos have been created, which clearly shows mass engagement with “Old Spice Guy” and by proxy the brand. Remixes of the campaign (such as “Old Spice Boy”2, “Study like a Scholar, Scholar”3 and the Alyssa Milano4 response video)
The content also shows a significant amount of news generated about the campaign being distributed and consumed on Twitter. ReadWriteWeb’s @rww account was posted most frequently only after Alyssa Milano and Old Spice’s Twitter accounts, respectively.
Hashtags
Although stop-word omitted concordances are more comprehensive in the process of discerning and assigning values of all words used in the data set, it typically involves much more labor in determining actual value of the terms rather than using the ad-hoc hash tag approach that has become part of the culture on Twitter. In other words, by looking only at the frequencies of hash tags, it is possible to gain quick insight as to the qualitative nature of the Tweets by category.
By and large, the bulk of hash tags employed in this campaign hinted at a primarily advertising-aware base; this is to say that instead of hash tags related to the content of the videos or the campaign, the hash tags appeared to be categorizing the campaign as a campaign.
Fig 8: Hashtag breakdowns, Old Spice data set again reinforced the notion that the planted viral campaign became much more similar to a
genuine meme.
Essentially, this implies that Users still passed around the content willingly despite its essential advertising nature. This is ostensibly due to its intrinsic humor in spite of the marketing nature, which has
generally not performed as well when overtly conducted on a social media site. Interestingly, #ff, or Follow Friday, was employed frequently, which implies that Users are actively engaging with the brand, whether this engagement was with Mustafa’s account as the “Old Spice Guy” or the Old Spice account itself is beside the point.
#SpiceBoy also provides a particularly interesting result – the creation of advertisement response videos essentially spreads the meme and evolves it to one more level without any more effort from the original creators. In fact, many response videos were created (as is well known). This response style of imitation is, in terms of internet memes, the sign of a bona fide adoption of the campaign into the online sphere. That the “Spice boy” video became widely adopted to the point of being a major subtopic suggests that this campaign is unique among many viral marketing campaigns in its ability to graft into the culture and be engaged by it.
Mentioned Users
Fig 9: Top mentioned users across all Tweets. This is the total occurrence count for User names – multiple Users mentioned in a single Tweet are counted individually
The most mentioned users in this data set are fairly consistent with early assumptions: Famous People are almost always on top, followed by the less-famous technology pundits, then mid-level users, and finally the general user base. By far, the most-cited user beyond the Old Spice account was Alyssa Milano, likely as a result of her response video/active role in the meme (and her significant celebrity status both on the network and outside of it). Other notable accounts were
similarly reasonable – Fast Company, Huffington Post, and ReadWriteWeb are all popular content distributors and were displayed prominently.
In response to Alyssa Milano’s challenge to Old Spice, the National Wildlife Federation’s account received a fair amount of traffic, and was spread through the system as much as Ashton Kutcher’s account, which speaks to a level of significance given Kutcher’s dominance in the network.
URLs
Fig 10: Top URLs, with YouTube sub-URLs counted individually.
General URL Analysis
Top 3 Most Shared OldSpice-created YouTube Videos:
- "Re: Everyone | Old Spice" (http://youtube.com/watch?v=nFDqvKtPgZo), 1,583 Occurrences, 3,634,779 views
- "Re: Haley | Old Spice" (http://youtube.com/watch?v=JvuYcbgZl-U), 1,182 Occurrences, 477,864 views
- "Re: @GStephanopoulos | Old Spice" (http://youtube.com/watch?v=J8Bli13rO9A), 1,146 Occurrences, 842,692 views
Table 2: Summary of top videos in the #OldSpice dataset
We compiled a list of all the URLs Tweeted in our data set and determined the number of occurrences of each URL. We expanded most URLs generated by URL-shortening services such as bit.ly. We also combined URLs that seemed to be merely variations of the same link. A total of 26,144 links occur in the set of Tweets.
From these links, we found 6014 unique URLs. This list can be useful for finding related articles or websites you were previously unfamiliar with. Or perhaps more importantly, this URL histogram allows us see what Old Spice-related links were most often shared by Twitter users.
Looking at the list, we can immediately see that a large percentage of the URLs are links to YouTube videos. This makes sense given that the driving force of the Old Spice campaign is the Old Spice Guy videos on YouTube.
Almost three-tenths of the total link occurrences were to YouTube videos, with the number-one most shared link pointing to the "Re: Everyone | Old Spice" video. Many of the other top-shared videos, however, were not OldSpice-created videos but parodies. View-count is, of course, one straightforward, general approach for measuring the success of a YouTube video. This URL histogram provides a more specific metric, one that shows the relative "success" of any URL
within a targeted data set.
Network Analysis
Fig 11:Re-Tweet Network Map, with small-node pruning enabled alongside logarithmic node sizing based on out-degrees
Identifying information in tabular forms of occurrence is useful, but the most accurate way of mapping information in a social network is by using the much more analogous network graph.
We visualized the most important users, as seen above, and adjusted their size for relative importance in the network (which was determined by the number of times they were referenced
by other users). These numbers were adjusted to show detail, and therefore follow a more logarithmic size pattern. In reality, Old Spice was referenced 9,038 times by other users (in either
re-tweets or direct mentions) and Alyssa Milano only 318 times, but the disparity takes away from actually understanding the long tail of distribution, so Old Spice’s account has been highlighted to note this difference. Redder nodes correspond to users closer to the central part of the graph – the reddest are one degree of separation from Old Spice, and the cooler nodes are farther away.
A largely blue graph, in this sense, would suggest a large net of distribution; one user receives the information from Old Spice, passes it to another, and that person passes it to another and so forth. Perhaps unsurprisingly, then, this network is very centralized – the fact that there are other blue nodes suggests actually multiple graphs – these users are actually not connected by any single Tweet, likely because we do not have that Tweet. Such an uneven distribution of outbound links (references to some user) exists in this data set to the point that it is unlikely that the data set is more like an organic conversation consisting of multiple major hubs. In other networks, such as the internet, you generally have a few major hubs with significant inbound links, such as Facebook, Google, YouTube, Yahoo, and Live, and then less popular sites with inbound links that
taper off less precipitously.
To put it shortly, most graphs have multiple important users, and as a result, cast a much wider net of users to respond to the major users. This graph does not share that feature, and as a result, much of the communication is one-to-many. The graph screenshot was pruned to eliminate almost 18,000 users (so as to only isolate the major users), so the large sunburst of data going from Old Spice outwards is not present (nor is it a compelling graph). The communication between other users, and from users out towards more users, is most important, and is not clearly happening as much as it would in a non-centralized graph.
That is not to say that the network doesn’t suggest any successes. In fact, the vast dominance of the Old Spice account speaks to a large degree of efficacy in being able to control the campaign from one central position and spread the information outwards. The results of this success are seen in numbers such as the significant uptake in followers for the account after the campaign.
Influential Users
Fig 12: Most influential users (after @OldSpice and @Alyssa_Milano) in re-Tweet network map; this is determined by out-degree distribution, or the number of other users referencing the user in their own
Tweets
To get a sense of the topology of the re-Tweet network, we ran a series of network analytics on the data set. Many times, the results of network analytics are nebulous, as factors such as incomplete graphs, poor modeling, and, at worst, misapplications of the analytics tools lead people astray. A simple method of analysis that does clearly resonate with this data set is the outdegree distribution, or the number of outbound links per user. The top users, aside from the
outliers OldSpice and Alyssa_Milano, are shown below.
Influenced Users
Fig 13: Most influenced Users (omitting “drippler” and “BobbyTheBlue”) in re-Tweet network. This is determined by the number of times these Users referenced other Users in the network.
On the other end of the spectrum, there are highly influenced users; generally, these are people that are simply spamming by re-Tweeting or direct mentioning accounts often (in order to show up in the search results for a given subject more often). While a few users (notably, “Drippler” and “BobbyTheBlue” with 202 and 41 in-degrees, respectively) were almost certainly attempting to exploit this, a few users were able to be influenced and in turn influence other users–the best example of this is “OhDoctah”, who influenced 89 users as a result of his 4 re-posts of @OldSpice Tweets.
Conclusion
The Old Spice data set is profoundly rich. Through multiple dimensions of analysis, we were able to confirm that the conversation on Twitter was likely beneficial to the overall campaign.
The largely American, primarily male audience both spread direct Old Spice content as well as derivative response content, ensuring an intrinsic memetic value in the campaign, which has lasting impact on the social media sphere.
Some of the most shared links directly tied back to campaign assets - the ones that did not were primarily either response videos/derivatives or news articles surrounding the campaign. In either way, negative content was not seen from the top responses, which implies general acceptance of the meme in the online sphere.
By using network analysis, we were able to show a general sense of the distribution of Tweets in a clear high-level view. The data appeared to emanate primarily from the central hub of the @OldSpice Twitter account and quickly dissipate from there - (there were not long trails of re-Tweets as can be seen from time to time, but are rare). The vast preponderance of re-Tweets referencing @OldSpice’s account suggest a high degree of centralization of network traffic, which means in turn that the account was likely successful in curating its own traffic and generating the types of data it desired, rather than having other users alter the messages and pass them along. The lack of negative hash tags similarly support this thought. Although there were a few spam accounts posting data about Old Spice (as is to be expected), there were a few notable accounts such as OhDoctah that both referenced Old Spice while cultivating their own following as an offshoot or derivative subject to the primary subject.
[1] A participatory Tweet is one that either specifically references another Tweet (a “re-Tweet”) or one that simply mentions another user (a “direct mention”).
[2] https://www.youtube.com/watch?v=FGbK0YiOKWo