#IranElection: Quantifying Online Activism

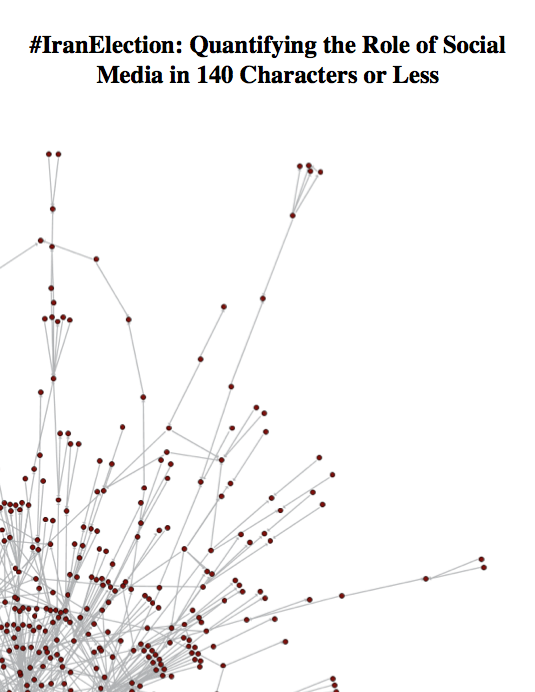
For the final year of undergrad in college, I wanted to narrow down to an insanely specific degree and study the impact (if any) of Twitter on the protests following the Iran Election. I use Sandor Vegh’s categorization scheme to break any piece of particulate conversation (or tweet) into one his three categories of messages in a larger online activist instance (awareness/advocacy, organization/mobilization, action/reaction). By analyzing the data to see the breakdown of messages on a quantitative level, I was attempting to understand the predominance of data in one of these categories, which could in turn give us a rough idea of a data-based solution on how the Iran Election was impacted. While the paper that I wrote eventually came to no major conclusions (as most papers tend to), through the process, I realized that the job of collecting and analyzing the data, while difficult, could be repeated for any other type of study.
In a small way, answering questions like this for a particular platform (in this case, the low-hanging Twitter-fruit), we can start to get at the role of the internet in all our lives (kinda-sorta), which is hugely important and very often lacks hard numbers. For this reason, I split the time working on the thesis and working on a piece of code that automated all the work I had done on my thesis. This way, if anyone wanted to come back and try thing their own way with their own information, there wouldn’t be any issue.